Wednesday, December 10, 2014

#20: Sketch Principles

1. Five Have

  • Perceptivity of Recognition
    • Recognition must be build upon human's perception, so a sliding window used in a sketch recognition is different from one used in a computer vision application.
  • Intuitive UI
    • According to many paper such as  KimChi paper, the role of interface is very important for efficient sketching
  • High tolerance
    • This can be also explained by the sliding window of a computer vision application. If the tolerance is low, the difference which users are not able to find will bring different results. Then, this can cause low usability.
  • less constrains
    • Users want to draw sketches with computer in the way they draw with a pen and a paper. Constrains hinder free sketches.
  • Consistency
    • Same input - same output

2. Five Have not

  • Inconsistency
    • Same input - different output
  • Many limitations
    • Not allow users to sketch drawing in their own way
  • Poor editing
    • Editing takes a major portion of sketching. If it is poor, there is not much benefit.
  • Bad UI
    • Lower usability
  • Low tolerance
    • Users want to draw a horizontal line, but the line might be a little curved or leaned. if tolerance is low, this line or most lines drawn by users cannot be interpreted as a horizontal line.

Paper Review #19: Tahuti

1. Paper Bibliography


  • TitleTahuti: A Sketch Recognition System for UML Class Diagram
  • AuthorsHammond, Tracy, and Randall Davis.
  • PublicationAAAI Spring Symposium on Sketch Understanding. Vol. 3. No. 2. 2002.

2. Summary

  • A Dual view, multi-stroke sketch recognition 
  • Sketch freedom
  • Taget application: UML diagram
  • Focus on geometric properties

3. Terminology

  • [WIKIPEDIA] Wizard of Oz experiment:
    • a Wizard of Oz experiment is a research experiment in which subjects interact with a computer system that subjects believe to be autonomous, but which is actually being operated or partially operated by an unseen human being. 

4. Details

  • Multi- layer framework

5. Evaluation

  • Scale 0 to 5
  • A) A paint program
  • B) Rational Rose
  • C) Tahuti in interpreted view
  • D) Tahuti in drawn view
  • Result
    • Drawing 
      • A: 2.25, B: 1.75, C: 4.375, D:3.1
    • Editing
      • A: 1.65, B.1.925, C: 4.825, D: 2.6

Paper Review #18: What!?! No Rubine Features?

1. Paper Bibliography


  • TitleWhat!?! No Rubine Features?: Using Geometric-based Features to Produce Normalized Confidence Values for Sketch Recognition
  • AuthorsPaulson, Brandon, et al.
  • PublicationHCC Workshop: Sketch Tools for Diagramming. 2008.

2. Summary

  • Goal
    • A hybrid approach that combines features from both traditional gesture-based recognition systems and geometric-based recognition systems.

3. Details

  • Gesture-based recognition + Geometric-based recognition
    • Rubine work (gesture part)
    • Hierarchical structure (geometric part)
 
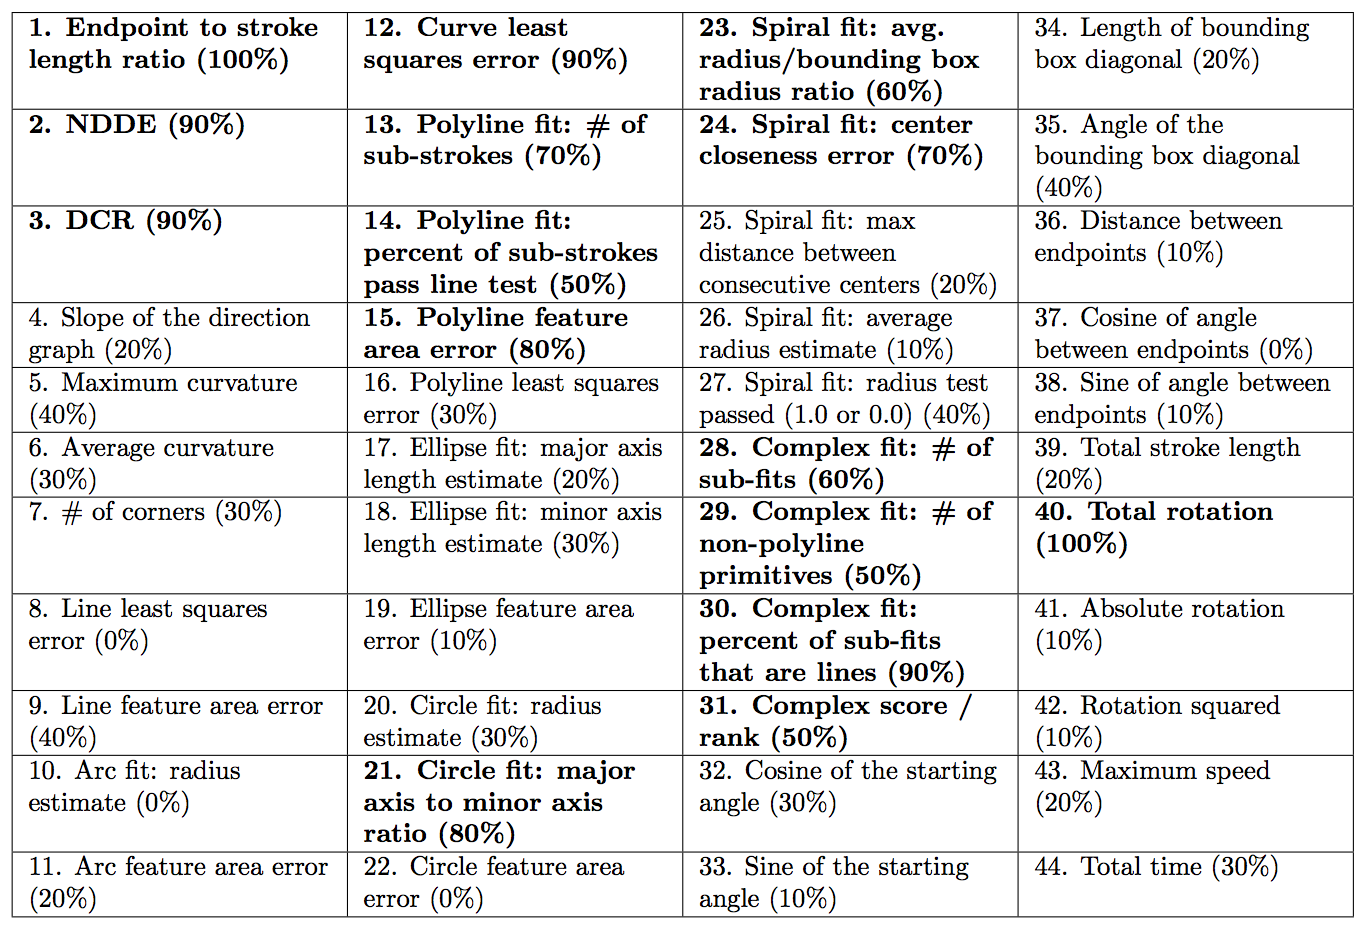
  • 44 Features

  • Data
    • 1800 sketches

4. Evaluation

  • Feature sub-selection

Paper Review #17: PaleoSketch

1. Paper Bibliography


  • TitlePaleoSketch: accurate primitive sketch recognition and beautification
  • AuthorsPaulson, Brandon, and Tracy Hammond.
  • Publication Proceedings of the 13th international conference on Intelligent user interfaces. ACM, 2008.


2. Terminology

  • NDDE: Normalized distance between direction extremes
  • DCR: Diction change Rate

3. Summary

  • A new low-level recognition and beautification system that can recognize eight primitive shapes, as well as combinations of these primitives, with recognition rates at 98.56%. 
  • Polyline: high DCR, low NDDE
  • Curve: low DCR, high NDDE

4. Details & Evaluation

  • Pre recognition
    • Resampling
    • Compute two features
      • NDDE = dist(point with the highest delta, point with the lowest delta) / the length of the stroke
      • DCR = biggest diction change / average direction change
  • Line test
  • Polyline, Ellipse, Circle, Arc, Spiral, Helix and Complex test

  • Evaluation

    Paper Review #16: LADDER

    1. Paper Bibliography


    • TitleLADDER, a sketching language for user interface developers
    • AuthorsHammond, Tracy, and Randall Davis.
    • PublicationComputers & Graphics 29.4 (2005): 518-532.

    2. Summary

    • LADDER is a language to describe how sketched diagrams in a domain are drawn, display and edited
    • To simplify a development of a new sketch recognition interface

    3. Details

    • Three main parts
      • Domain description
        • Definitions of shapes: predefined shapes -> constraints
          • Hierarchical, Abstract, 
          • Vectors = sub components
      • Translation
        • Generating shape recognition
        • Generating editing recognition
        • Generating shape exhibitors
      • Sketch Recognition system
        • Recognition
        • Editing
        • Display
    • Multi-domain recognitions system
      • Primitive shapes -> domain shapes
    • Constrains solver
      • Take in a shape description and initial location for all of the sub shapes and outputs the shape with all the constraints satisfied.
      • Example


    4. Evaluation

    • Auto-generation
    you can download and run the code: http://srl.cse.tamu.edu/srlng/research/project/3

      Paper Review #15: Recognizing Interspersed Sketches Quickly

      1. Paper Bibliography


      • TitleTahuti: A Sketch Recognition System for UML Class Diagram
      • AuthorsHammond, Tracy, and Randall Davis.
      • PublicationProceedings of Graphics Interface 2009. Canadian Information Processing Society, 2009.


      Paper Review #14: Using Entropy to Distinguish Shape Versus Text in Hand-Drawn Diagrams

      1. Paper Bibliography


      • TitleUsing Entropy to Distinguish Shape Versus Text in Hand-Drawn Diagrams
      • AuthorsBhat, Akshay, and Tracy Hammond. 
      • PublicationIJCAI. Vol. 9. 2009.

      2. Summary

      • Distinguish between shapes and texts 
        • Text has higher entropy rate than shapes
        •  Entropy rate = distinguishing factor
      • Using only the entropy rate, a correct classification rate is 92.06%
      • Favorable performance without training data

      3. Terminology

      • Entropy rate: accurate criterion of classification

      4. Details

      • Entropy
        • Each point in a stroke is assigned a symbol based on the angle (corresponding angle in the Table 1)

      In this figure, text has various symbol compared to rectangle.


        • This symbol is the random variable on the basis of which we can calculate entropy.
        • Use a zero-order entropy
          • each symbol's probability of occurrence is determined independent of the previous symbols.
        • Define an entropy model 'alphabet'
      • Implementation
        • Stroke Grouping
          • A spatial and temporal threshold
          • The successful rate: 99.78%
          • After groping
            • Resample 
            • Transform each stroke into a string of symbols
            • Calculate the percentage of the occurrence of symbols
        • Classification
        • Confidence Measure
          • in order to integrate a classifier into other sketch recognition 
        • Data collecting and Testing


      5. Evaluation